aguirre_figure_resized
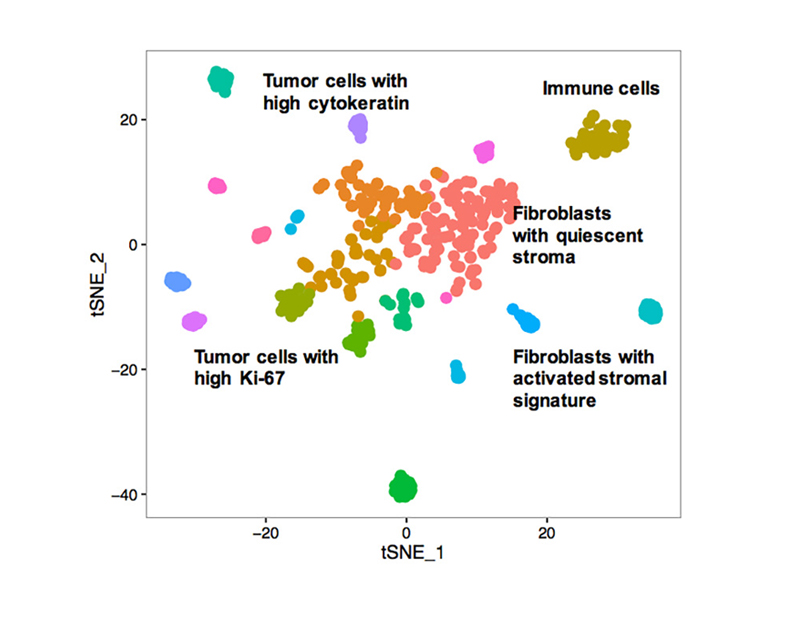
Representative t-SNE plot of single-cell RNA sequencing data of ~500 individual cells dissociated from a metastatic PDAC core biopsy. Cells segregate by distinct expression features due to differences in cell type and cell state, enabling evaluation of intratumoral heterogeneity of cell phenotypes.