mancias_figureresized
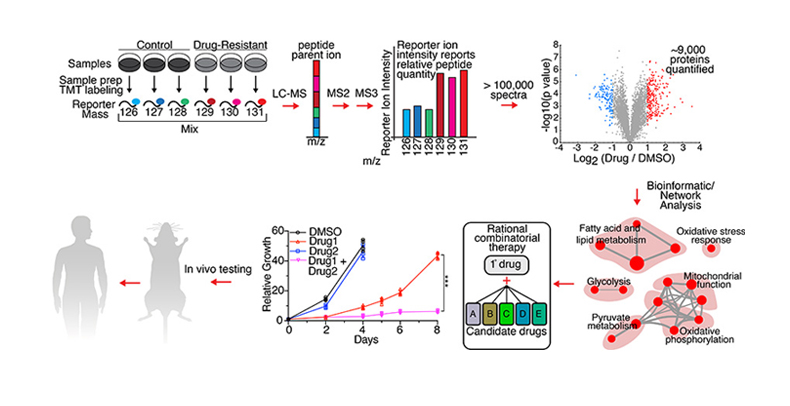
Therapeutic Resistance Quantitative Proteomic workflow. Drug-resistant PDAC cells are profiled using Tandem Mass Tag (TMT) quantitative global proteomics. Samples are labeled with TMT reporter tags and analyzed by LC-MS (liquid chromatography-mass spectrometry), followed by MS2 and MS3 fragmentation, resulting in relative quantitation of the global proteome. A volcano plot illustrates protein abundance differences in a PDAC cell line treated with a drug. Red and blue: top 5% up-, down-regulated proteins. Bioinformatic and network analysis leads to a map of upregulated pathways. Rational combinations are predicted and tested in vitro to determine ability to prevent or circumvent development of resistance. Effective combinations are tested in vivo in a PDAC mouse model with the eventual goal of translating to a human clinical trial for PDAC patients.